
In the last issue of Xiaoao Classroom, we talked about the development of ELISA Methodology Development Practice Edition - Quantitative Methodology for Biomacromolecules Detection .
In this issue, Xiaoao will share another important topic with you: "ELISA Methodology Development Practice Edition - Affinity Determination Method Development".
I. Introduction
The current methods for determining the affinity between receptor ligands, that is, the dissociation equilibrium constants, are mainly:
- Thermodynamic determination method
- Kinetic determination method
- Saturated concentration method
Among them, the kinetic determination method and the saturation concentration method are more common: the kinetic determination method (such as Biacore) involves relatively expensive instrument input, and the saturation concentration measurement method is commonly used in most domestic biopharmaceutical enterprises.
The ELISA for the determination of affinity is the mainstream mode of the saturation concentration assay, and is commonly used for the activity evaluation of protein levels of antigenic proteins or antibodies and the long-term stability evaluation of antibodies.
ELISAs for affinity assays often have no commercial kits and require experimentation by methodologists.
Due to the lack of education in biotechnology and the insufficient accumulation of new drug research and development companies in this application, a methodologically validated ELISA affinity measurement method is a difficult task for many practitioners, and it is likely to be delayed. Such as the new number to pass errors or deviations.
One of the largest applications was the development of an ELISA affinity assay using ELISA-quantified experimental conditions.
This paper starts with the basic principle of affinity determination method , describes the basic principle of affinity determination of saturated concentration method, outlines the dose relationship of antigen and antibody in the development of ELISA method, and several possible occurrences when ELISA is applied to the method of affinity determination. Errors, and introduce the general affinity determination program and the preliminary methodological development program.
Second, the basic concept of affinity
We analyze several chemical reaction cases and explain what is called affinity.
Example A
Hydrogen and oxygen form water under ignited conditions.
When the reaction is stopped, if the molar concentration of hydrogen in the reaction environment happens to be twice the molar concentration of oxygen, both are consumed, and only water is present in the reaction environment; if the molar concentration of hydrogen is more than twice the molar concentration of oxygen When oxygen is consumed, only hydrogen and water are present in the reaction environment; when the molar concentration of hydrogen is less than twice the molar concentration of oxygen, hydrogen is consumed, and only oxygen and water are present in the reaction environment.
This is the basic knowledge of chemical reactions. As a result of the chemical reaction, the reactants can completely become a product, that is, the reaction can proceed to the end, and the reaction of the reaction and the characteristic of the reaction is called an irreversible reaction.
Example B
The PD1 antigen (CD279) and the PD1 antibody (such as pe mbrolizumab) are reacted at normal temperature and pressure.
When the reaction is stopped, if the molar concentration of CD279 in the reaction environment is 200 nM and the molar concentration of pembrolizumab is 100 nM, the concentration of pembrolizumab-CD279 complex is 97.86 nM under ideal conditions, the molar concentration of CD279 is 4.28 nM, and the pembrolizumab is 2.14. nM;
If the molar concentration of CD279 in the reaction environment is 100 nM and the molar concentration of pembrolizumab is 200 nM, the concentration of pembrolizumab-CD279 complex is 49.81 nM under ideal conditions, the molar concentration of CD279 is 0.38 nM, and the pembrolizumab is 159.19 nM.
Example C
The PD1 antigen (CD279) and the PDL1 antigen (CD274) are reacted at normal temperature and pressure.
If the molar concentration of CD279 in the reaction environment is 200 nM and the molar concentration of CD274 is 100 nM, the concentration of CD274-CD279 complex at the completion of the reaction is 2.35 nM, and the molar concentration of CD279 is 197.65 nM. The molar concentration of CD274 is 97.65nM;
If the molar concentration of CD279 in the reaction environment is 100 nM and the molar concentration of CD274 is 200 nM, the concentration of CD274-CD279 complex at the completion of the reaction is 2.35 nM, and the molar concentration of CD279 is 97.65 nM. The molar concentration of CD274 is At 197.65 nM, the vast majority of CD279 and CD274 did not participate in the reaction.
In both cases B and C, both the antigen and the antibody (ligand and receptor) binding reaction, the two reactions have a positive reaction process to form a complex, and the complex dissociation reaction produces an antigen, antibody reverse reaction process, and finally The result is a state in which the antigen, the antibody, and the antigen-antibody complex coexist.
Such a reaction is called a reversible reaction .
When the speed of the positive reaction and the reverse reaction are equal in a reversible reaction, the concentration of the antigen, the concentration of the antibody, and the concentration of the antigen-antibody complex in the reaction system no longer increase or decrease, the reversible reaction is completed, and the molar concentration of each component in the reaction system is at a constant dynamic equilibrium.
Affinity (Affinity) is a reversible reaction process, antigens, antibodies, and antigen - characteristic parameters of the relative state between antibody complexes, and more professional name of the terminology is the dissociation equilibrium constant KD, unit mol / L (concentration and Units are consistent) .
The smaller the affinity value, the stronger the affinity, and the strength of the affinity determines the relative amount of each component of the reversible reaction when the reaction is finally determined.
As in Examples B and C, as well as 200 nM CD279 (PD1) , the affinity of the antibody pembrolizumab (PD1 antibody) relative to CD279 was 0.4 nM, the affinity of the ligand CD274 (PDL1) relative to CD279 was 8200 nM, and the final reaction produced pembrolizumab The CD279 complex is 97.86 nM, while the CD274-CD279 complex is only 2.35 nM, which is 42 times different.
Unlike the irreversible reaction, in addition to the molar concentration of the antigen and antibody , the affinity between the antigen and the antibody (ligand and receptor) will greatly affect the amount of the product in the reversible reaction.
3. Do you know the basic principles of ELISA for methodological development?
For an overview of the methods and principles of affinity determination, the reader can refer to the affinity evaluation of biofunctionality screening evaluation techniques.
This paper mainly summarizes the saturation concentration method.
R represents a receptor or an antigen , and L represents a ligand or an antibody .
Using the saturation concentration method, if the affinity of the ligand relative to the receptor is to be determined, a small amount of R is present, and L is subjected to gradient dilution to detect the concentration of the RL complex, when the concentration of the RL complex accounts for half of the total R concentration. The concentration value (EC50) corresponding to L is the KD value of L with respect to R.
The RL complex/R or B value can be replaced by the detected signal value, and the functional relationship between the gradient diluted L and the signal satisfies the following formula, and only the EC50 value can be equivalent to the KD value under specific experimental conditions.
The saturation concentration method has several key points for determining the KD value, that is, two molecules interacting, R is a small amount, and L is subjected to continuous gradient dilution, and the maximum signal response value is required (all R binding sites are occupied by L). time) i.e. plateau, then under this condition, occupies half of the R, L concentration (the EC50 of) the desired value for the KD.
The saturation concentration method mainly determines the signal value representing the RL complex, and the measurement method may be flow cytometry, isotope labeling, fluorescence polarization, or ELISA.
Fourth, commonly used methods for ELISA methodological development for affinity determination
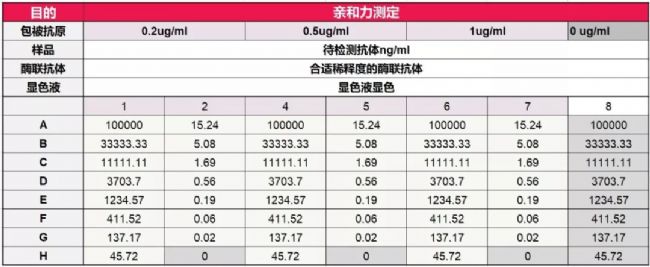
layout 
General operating procedure
01 Preparation of the enzyme plate: Take the concentration of 100 ug / ml antigen, dissolve at room temperature, mix with the coating solution as follows to dilute to 0.2ug / ml, 0.5ug / ml, 1ug ​​/ ml, according to the sample layout table 100 ul / well, respectively, added to the enzyme label strip (Note 1) , which was added with a coating solution to coat the antibody blank, 2-8 ° C overnight;
02 Wash the plate 3 times with washing solution, pat dry, add 300 ul / hole blocking solution (Note 2) for 1 hour at room temperature; wash the plate 3 times, pat dry for use;
03 The antibody was diluted 3 fold (Note 3) starting at 100,000 ng/ml according to the layout, and 100 μl/well was added to the microplate according to the layout;
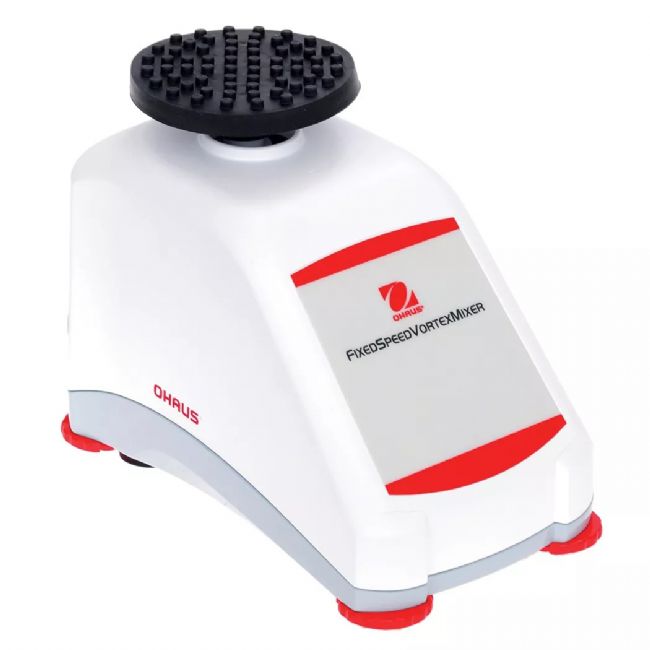
04 placed in the Ohaus microplate oscillator  (ISLDMPHDG) , set at 37 ° C, 600 rpm for 1 hour;

05 Wash the plate 3 times with washing solution, pat dry;
06 was diluted to a suitable concentration of enzyme-linked antibody (Note 4), on Ohaus Vortex (VXMNFS) mixing, 100ul / aperture;

07 placed in a microplate oscillator, set at 37 ° C, 600 rpm shaking for 1 hour;
08 Wash the plate 4 times with washing solution, pat dry;
09 Take the enzyme solution corresponding to the enzyme-linked antibody, take out the balance to room temperature 20 minutes before use, and mix on the vortex mixer;
10 Add the coloring solution at 100 ul/well using an 8-row gun;
11 color solution is placed in the dark at room temperature for 10-30 minutes (Note 5) ;
12 Terminate the reaction by adding a stop solution at 100 ul/well using an 8-row gun (this step may not be required depending on the substrate) ;
13 using a microplate reader to determine the signal value (Note 6) ;
14 results analysis (Note 7) .
Intimate little NOTE
Note1: If it is necessary to reduce the non-specific adsorption of high concentration of antibody (100000 ng/ml) on the enzyme plate during the reaction, it is recommended to select a hydrophobic plate (polysorp) during the coating process. The coated antigen concentration needs a small amount of 0.2. -1 ug/ml, the specific situation needs to be judged and optimized according to the affinity of the antigen-antibody. In general, the stronger the affinity, the lower the concentration of antigen coating required.
Note 2: The blocking solution does not necessarily have a blocking effect and requires experimental verification (grouping of uncoated antigens) . Generally, the smaller the molecular weight, the better the blocking agent.
Note3: In the initial stage of methodology development, the concentration range of the standard curve can be increased by 100000 ng/ml-0.1 ng/ml to obtain a full curve with obvious upper and lower plateau periods. When the affinity between antigen and antibody is strong, the gradient concentration can be reduced. The dilution factor can be reduced by a factor of two during the method optimization process.
Note4: Excessive effect of enzyme-linked antibody, dilution of enzyme-linked antibody requires different dilutions for comparison. For enzyme-linked antibodies with monoclonal antibody components, if the enzyme-linked antibody of two dilutions can produce the same dose curve, There was an excess of enzyme-linked antibodies, and there was no bias in the signal transduction by ELISA.
For the enzyme-linked antibody of the multi-antibody component, the dilution degree is judged to be complicated, and the molar concentration of the enzyme-linked antibody can be calculated at least 5 times higher than the molar concentration of the antigen on the coating. When the concentration of the enzyme-linked antibody is small, the enzyme-linked antibody is captured under high-dose and different concentrations of the antibody, and the curve has a pseudo-upper platform.
Note5: For the absorbance value substrate and the fluorescent substrate, the signal value detected by the instrument is proportional to the color development time, and it is preferable to control it for 10-30 minutes. It is necessary to confirm the linear range of the signal of the detection instrument in advance. For example, the linear range of the absorbance value of the general microplate reader is 0-3, the absorbance value is non-linear between 3-4, and the control signal value should not exceed when the color is developed. 3. When the signal value exceeds the linear range, the curve has a false upper platform.
Note6: Different substrates need to be tested with different instruments, absorbance readings, fluorescence readings, and chemiluminescence readings. Pay attention to whether the laboratory's microplate reader has this type of reading function during the substrate selection process.
Note7: The standard dose curve fit is generally fitted with a four-parameter fit. It requires a significant plateau (A, D value) , the slope is generally between 0.8-1.2 (B value) , and the EC50 ( C value) is the antibody. Affinity value relative to antigen.
V. Summary
According to the saturation concentration method, when using ELISA for affinity determination, an obvious four-parameter S-shaped curve is required, that is, a signal curve that gradually changes with the antibody concentration is required.
At the low and high concentrations of the antibody, there is a significant plateau period, and the antibody concentration (EC50) corresponding to half of the upper plate signal value is the KD value of the affinity between the antigen and the antibody.
Since the linear range of the instrument's detection signal is limited, when the signal exceeds the linear range, the curve enters the false upper plateau period so that the measured affinity is not accurate.
The concentration of the coated antigen directly determines the maximum signal value of the signal, so when the affinity is measured by ELISA, the concentration of the coated antigen should be as small as possible to obtain a suitable signal value; if the concentration of the enzyme-linked antibody is too low, the curve may be made. Enter the fake platform period.
In the ELISA methodological development process, the enzyme-linked antibody excess to ensure the linear transmission of the signal needs to be experimentally verified.
When the signal fails to obtain a valid plateau, it indicates that the affinity between the antigen and antibody is too weak or the antigen is too much, and a larger concentration of antibody is required to allow all antigens to be completely grasped to reach the plateau.
Limited by the sensitivity of ELISA, in some antibody antigens with weak affinity (>100nM) , the ELISA method can hardly obtain an effective plateau period, and accurate affinity values ​​cannot be measured.
When ELISA is used to determine the activity of an antigen or to measure the activity of an antibody, the EC50 obtained is not as small as possible. When the signal enters the pseudo-platform stage (reaching the detection limit of the instrument and the enzyme concentration is small) , the EC50 becomes smaller, thereby obtaining Wrong affinity data, which is also the most common fallacy in ELISA for affinity determination.
Many manufacturers of antigenic proteins today have such errors in the evaluation of antigenic activity.
The affinity between the antigen and the antibody is determined by the structure and interaction of both, and may be 0.1 nM, 1 nM or 1000 nM. To evaluate whether the ELISA affinity method is good or bad, it is necessary to see whether the EC50 value is consistent with the affinity value. The affinity value can be verified by various methods such as thermodynamic measurement method, kinetic measurement method and cell flow assay in the saturation concentration method.
Conversely, when an ELISA method does not have a delay such as the signal entering the pseudo-platform stage (reaching the detection limit of the instrument, the enzyme concentration is small) , the EC50 value can truly reflect the affinity value.
Methodological development using ELISA requires clear application objectives, macromolecular quantitation and affinity determination.
For different application purposes, the relative dose concentration of antigen and antibody will be very different, and there are different dose curves. The reader can combine the above- mentioned "ELISA Method Development Practice Edition - Quantitative Method Development of Biomacromolecular Detection" for comparative study. , clear differences.
This time, sharing is here, we will meet again in the next issue!
Previous article
Ohaus assists in the localization of HPV vaccine
The Truth About Gene Encoding - Decrypting CRISPR
What are the people who want to buy a laboratory shaker?
Detect those things | Your experimental instrument went on strike again?
The biopharmaceutical researcher must have an ELISA development method that is more terrible than leukemia. The application of schistosomiasis Ohaus shaker in blood treatment
Want to know about Ohaus's high quality products? Please call the Ohaus sales service line "4008-217-188" or enter " Request Information " to leave your information, our professional engineers will be happy to help you!
If you want to read more exciting articles, please pay attention to WeChat public number American Ohaus !
Manual Massage Collapsible Foot Spa Massager
The Manual Massage Foldable Foot Spa Massager is a portable compact device designed to give your feet a relaxing massage experience. Its foldable design makes it easy to store and transport, making it ideal for the frequent traveler.
Massagers typically have multiple massage rollers that apply pressure to different areas of the foot, providing a deep-tissue massage that can help relieve tension and improve circulation. Some models also feature heating and vibration to further enhance the massage experience.
To use the massager, you simply fill it with water and turn it on. The water will heat up and the massage rollers will go into action to provide a soothing massage that will help relax your feet.
Overall, the Manual Massage Foldable Foot Spa Massager is an excellent choice for anyone looking to relieve foot pain and tension in the comfort of their own home.
Manual Massage Collapsible Foot Spa Massager,Foot Bath Massager Machine,Electric Heated Foot Spa,Foot Bath Tub
Huaian Mimir Electric Appliance Co., LTD , https://www.mmfootbath.com